The financial wealth of Canada’s top 1%
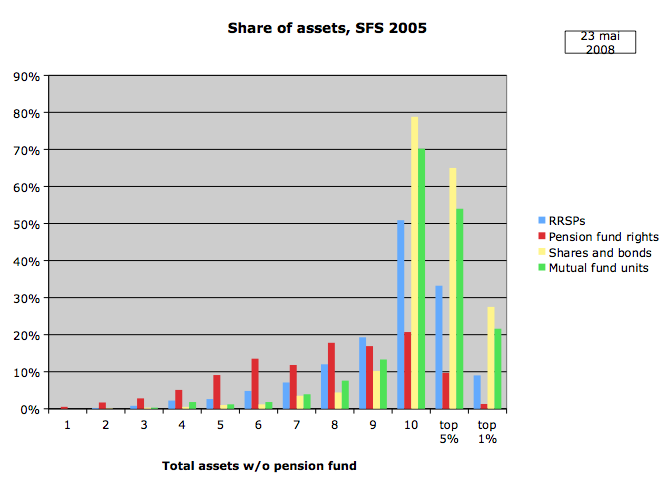
Following up on my post on wealth and income of the top 1%, Eric Pineault wrote to add some data on financial wealth distribution for Canada. He had a research assistant comb through microdata from Statcan’s Survey of Financial Security from 2005, and notes: “the 1% richest (all households are classed according to net worth rather then income) hold 22% of mutual fund assets, 27% of stocks and bonds, 9% of RRSP’s. You’ll notice that rights on pension funds are the most democratically distributed form of financial asset.”
Shares for the top 10% are similarly striking: almost 80% of shares and bonds; 70% of mutual funds; half of RRSPs. The comment on rights to pension funds is spot on for this group as well. We would do well to remember that when governments and corporations seek to cut back on defined benefit pensions, as well as in debates around the Canada Pension Plan.
UPDATE (Oct 28): We’ve since had some back channel discussion about sample sizes and what they mean for the interpretation of financial wealth of the top 1%. The Survey of Financial Security for 2005 only had a sample size of 5,000. While this is pretty large for a survey, and way larger than most poll results reported in the newspaper, it suggests some need for caution on the top 1% estimates in particular (especially given refusals to be interviewed). The 1% share of wealth is thus an estimate, and could be higher or lower. Still, it is useful to have an approximation out there, based on an actual Statscan survey, warts and all, than nothing. It also highlights the need for Statscan to develop a new survey with a bigger sample size, and to pay more attention in all of their reporting to what is happening in the tails of the distribution.

