
Inequality-redistribution in Canada update
Two years ago I posted my first guest blog focused on income inequality, specifically how changes in Canada’s redistribution over the last three decades have increased after-tax income inequality, and how these changes compared to OECD trends. The figures and analysis in this post update the earlier blog, based on the most recent OECD data to 2015. I also look at the market inequality-redistribution relationship and find that Canada is the only country that combines low market inequality with low redistribution.
Figure 1 presents market and after-tax income Gini coefficients for Canada and selected OECD countries. Market income is before taxes and government cash transfers, while after-tax income is after such taxes and transfers. The Gini coefficient varies from 0 to 1.00, with higher values representing higher inequality. Figure 1 includes data on the USA, the four larger Nordic countries (“Nordics-4”): Denmark, Finland, Norway and Sweden) and the other eight OECD countries for which data are available from the mid-1980s (“Other OECD-8”: Australia, France, Germany, Italy, Japan, Netherlands, New Zealand and UK). I have annotated Figure 1 to explain these inequality-related concepts and data. Focusing on the last few years (readers can refer to the earlier blog for a longer-term analysis), Figure 1 shows a general continuation of recent trends. Market inequality in the Other OECD-8 and Nordics-4 has continued to increase, while the long-running economic expansion in the USA appears to have finally (and perhaps only temporarily) paused the long-term increase in market inequality in that country. Canada continues to have relatively low market inequality and average after-tax inequality.
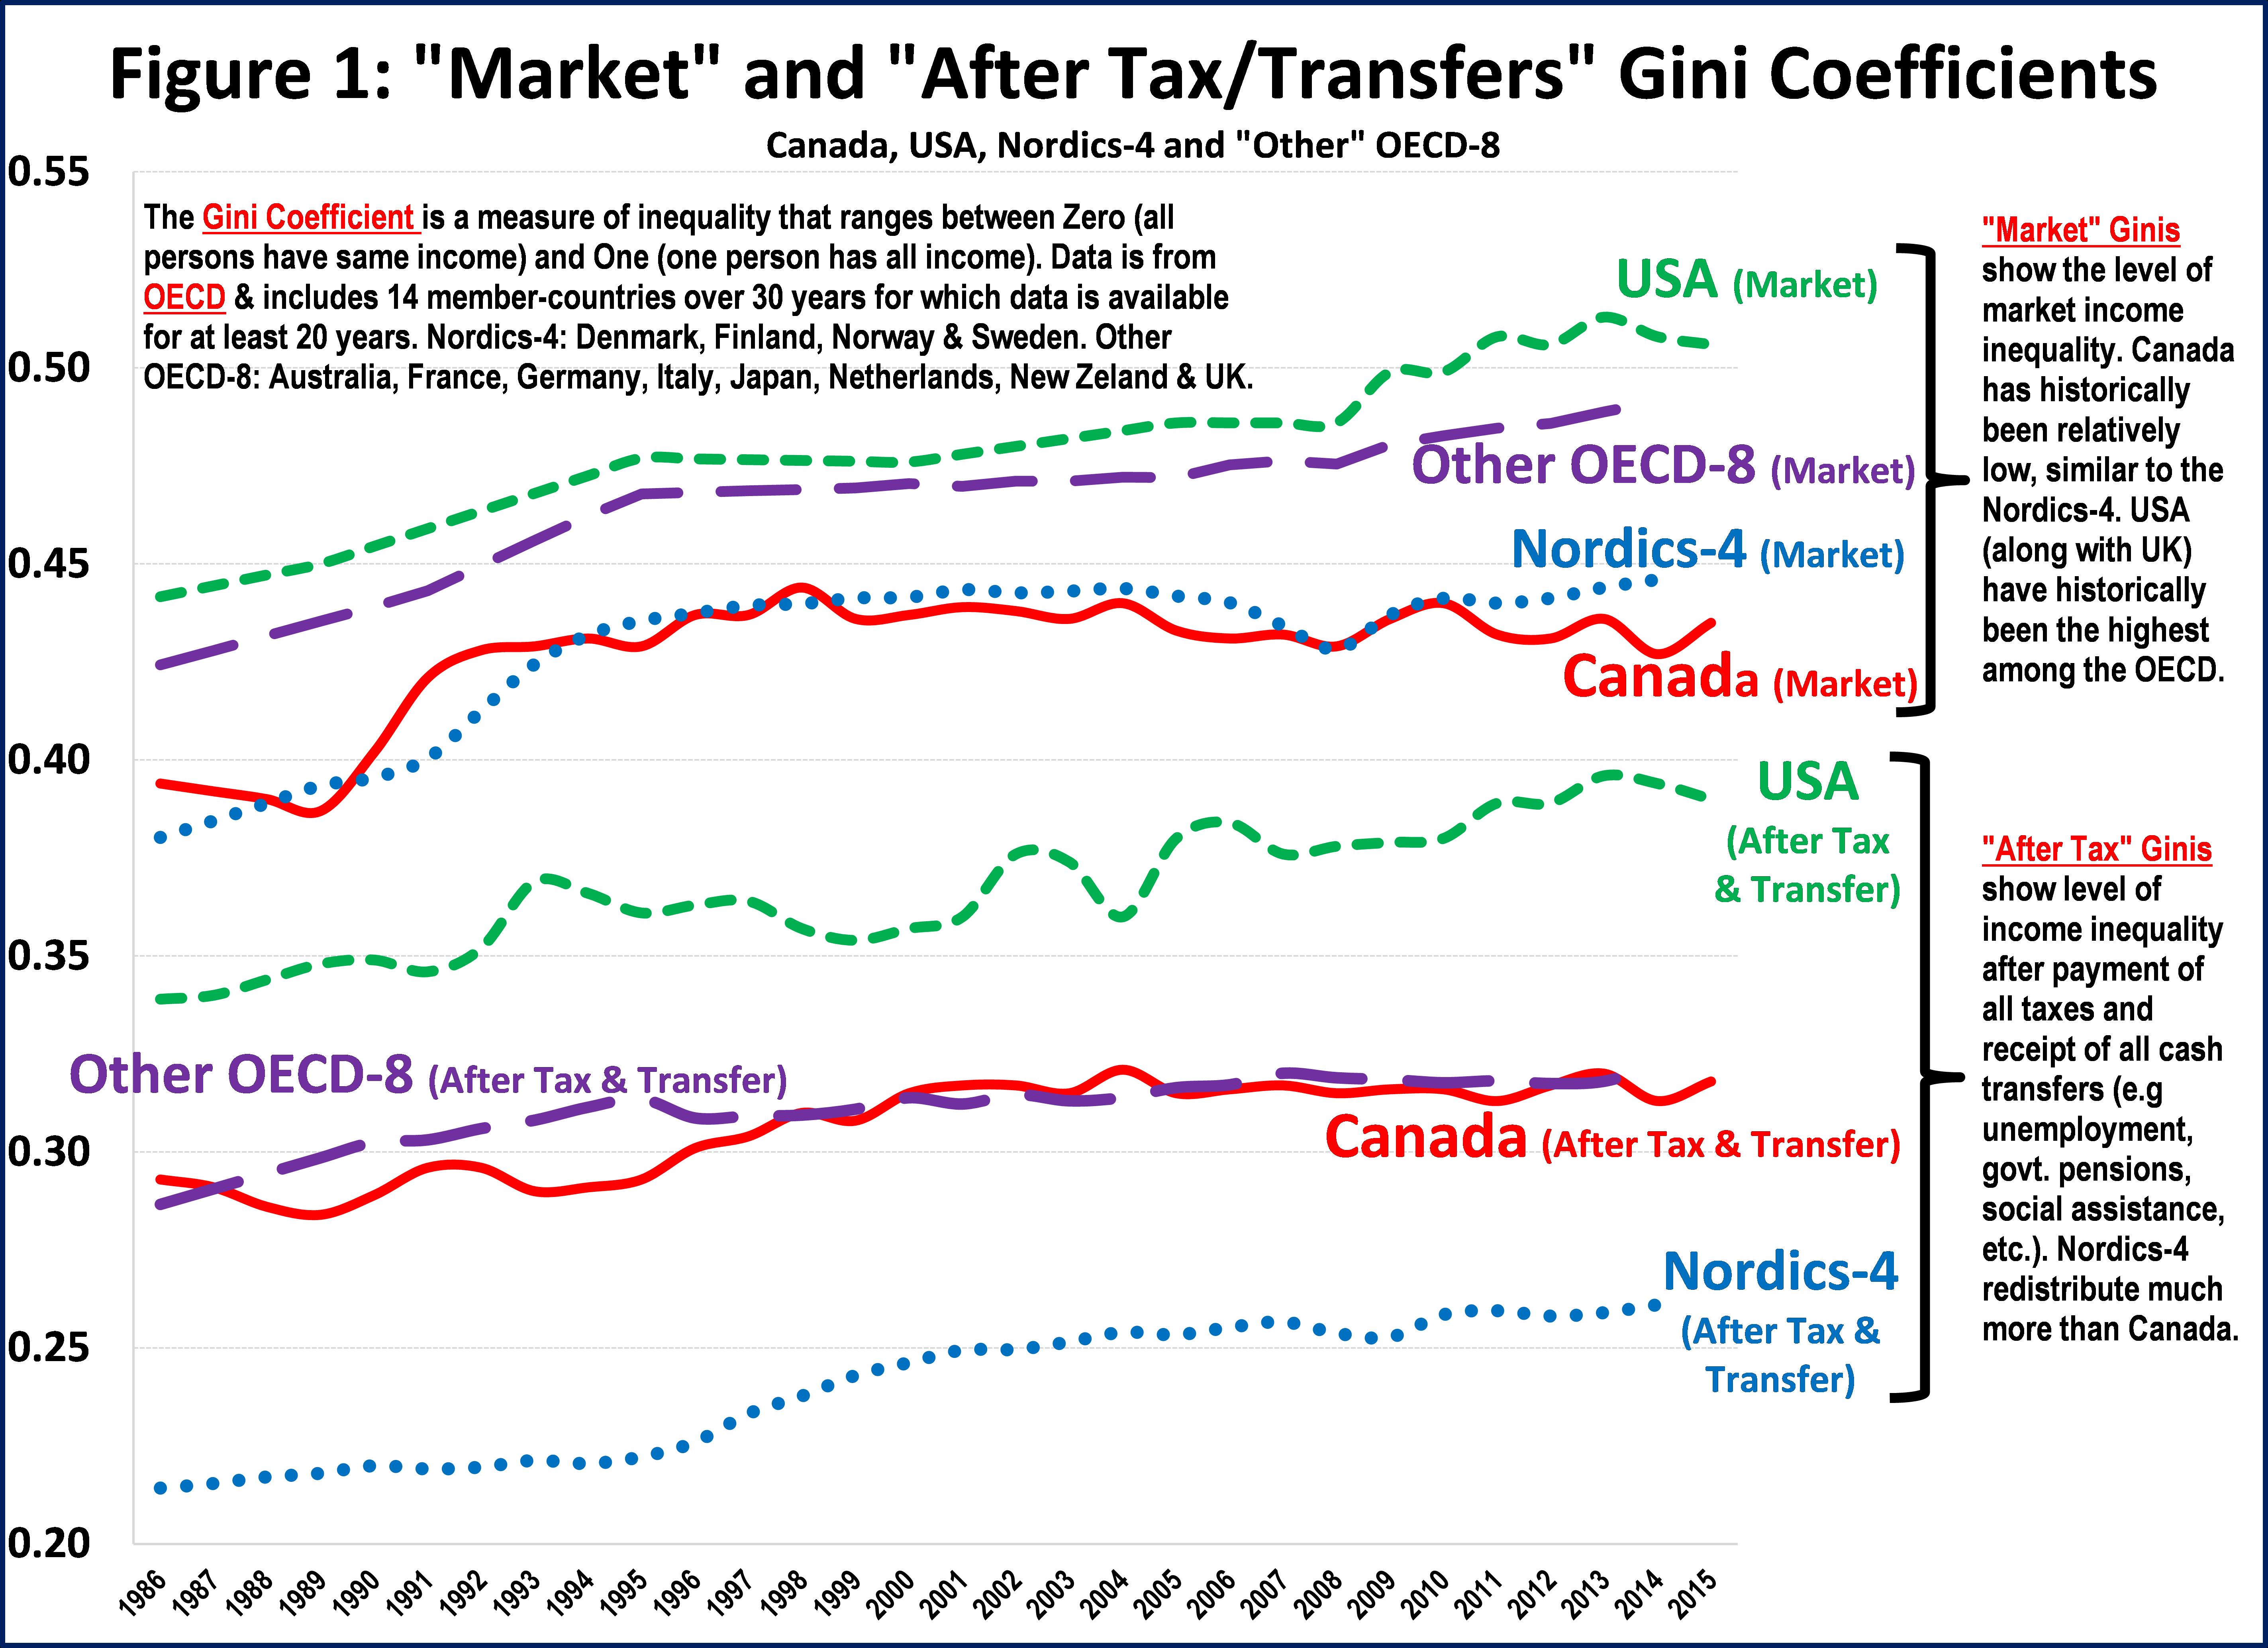
Figure 2 shows the percentage point difference between market and after-tax income Gini coefficients and reflects the extent to which Governments reduce market inequality by taxes and cash transfers. The Nordics-4 have traditionally had the highest level of such redistribution, currently lowering inequality by about 50% more than Canada does. Over the last decade Canada and the USA have had about the same low levels of redistribution (the two lowest among the OECD).
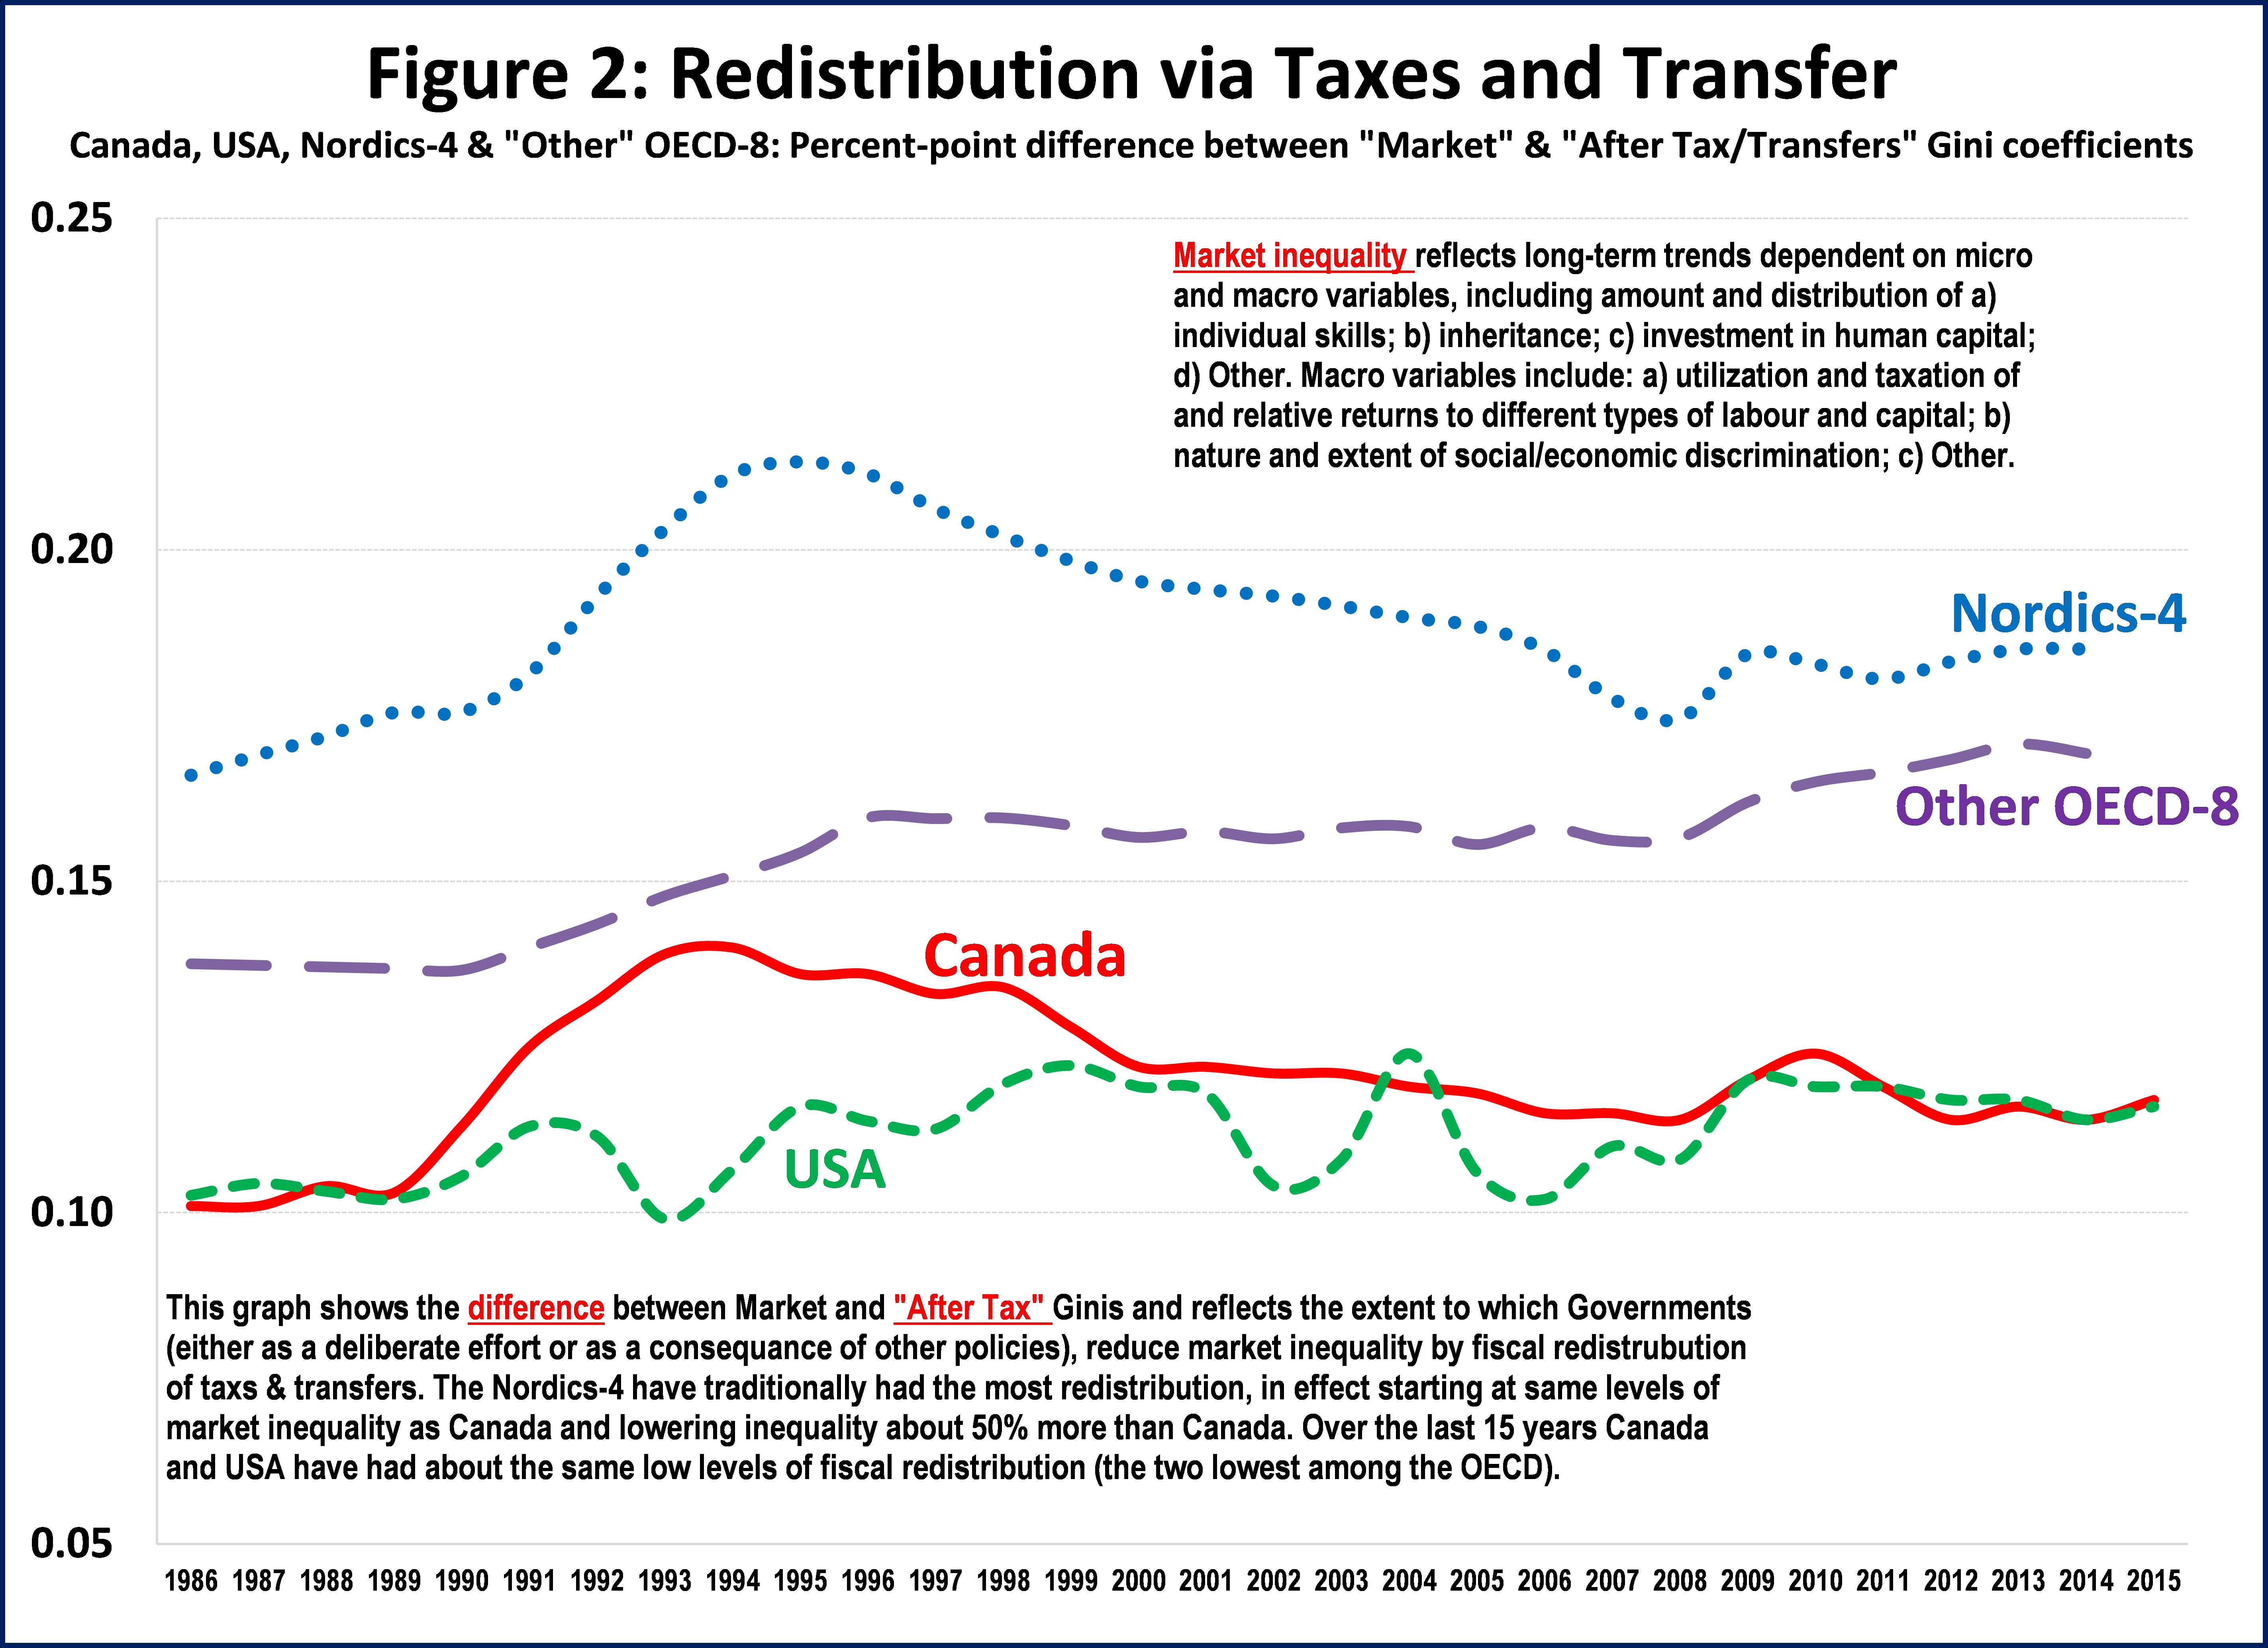
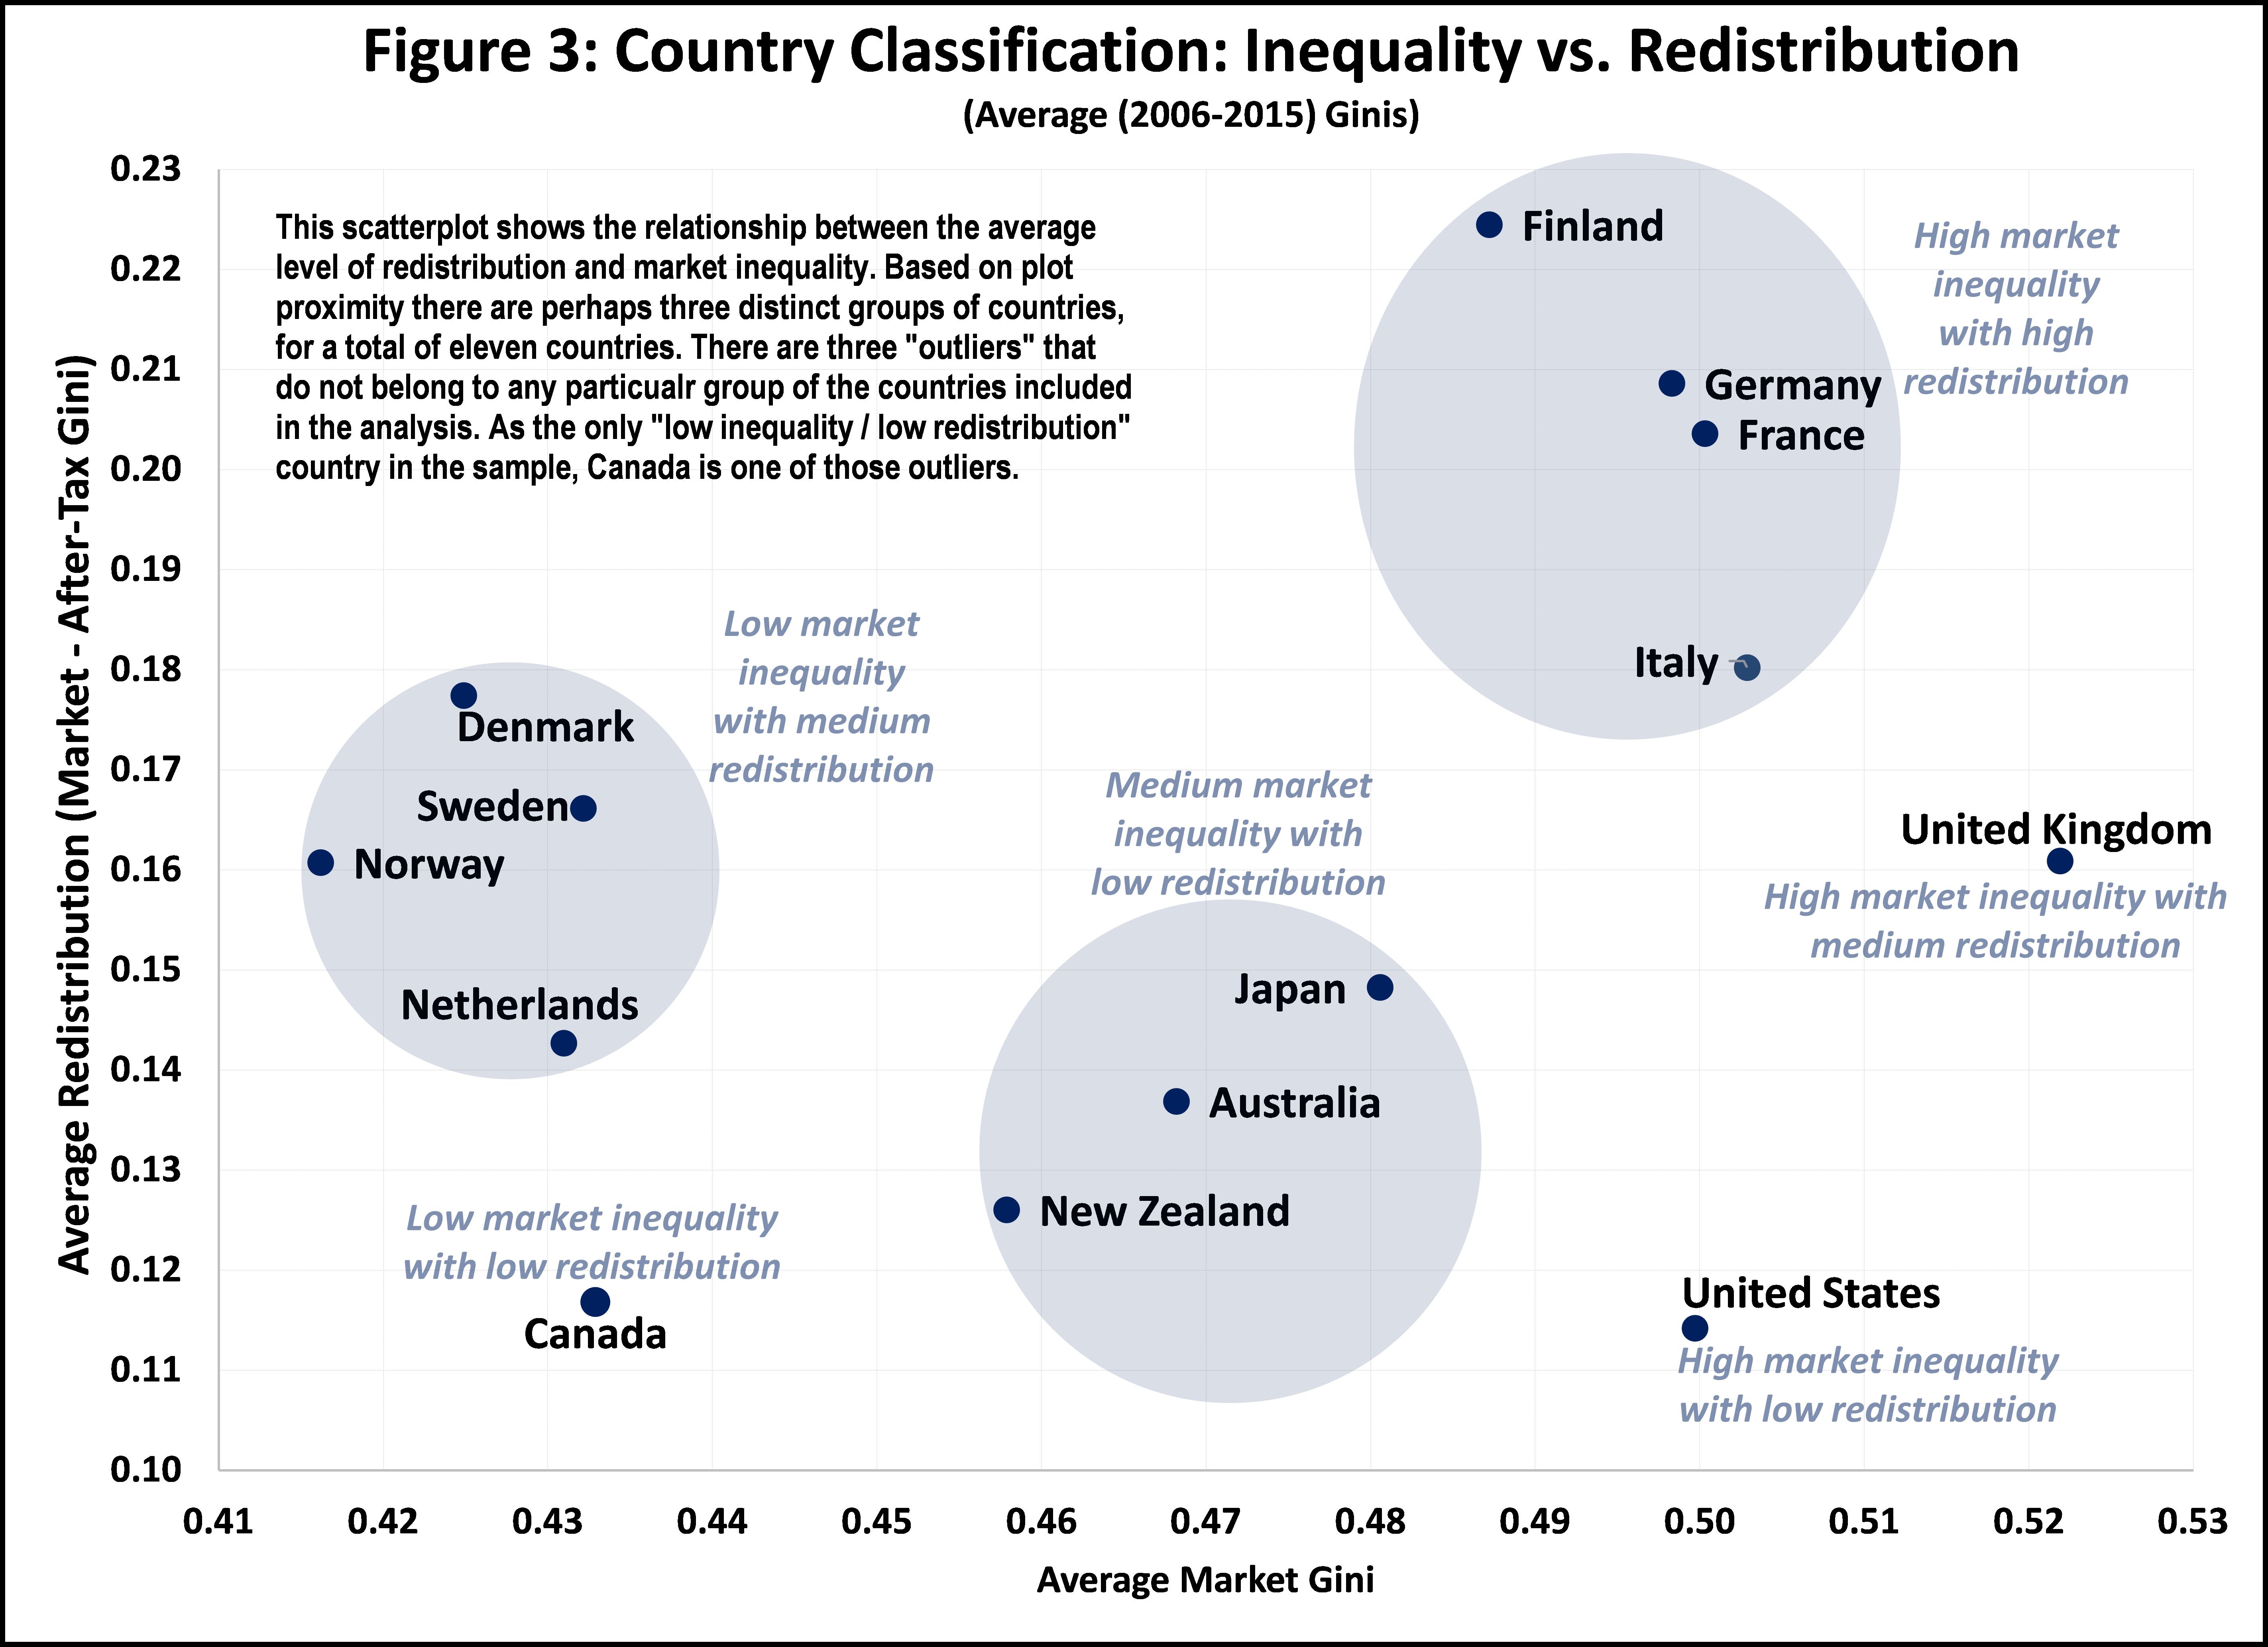
Figure 3 shows the political-economy outcome of the market inequality-redistribution relationship. For each of the 14 OECD countries listed above, Figure 3 includes average market inequality plotted against average redistribution (as measured above). Figure 3 appears to include three distinct “clusters” of countries:
- Low market inequality with medium redistribution, including Denmark, Netherlands, Norway and Sweden.
- Medium market inequality with low redistribution, including Australia, Japan and New Zealand
- High market inequality with high redistribution, including Finland, France, Germany and Italy.
These three clusters include a total of eleven countries, leaving three “outliers” that do not belong to any particular cluster. Canada is one of these outliers, being the only “low inequality / low redistribution” country. Others are the USA (high market inequality with low redistribution) and the UK (high market inequality with medium redistribution).
Each country’s inequality-redistribution outcome is the result of a series of complex national political-economy interactions. The cluster analysis in Figure 3 shows, however, that international and regional influences also matter. It is perhaps not surprising that Australia and New Zealand are in the same cluster, as is Japan. The “Nordic” cluster (including Netherlands but excluding Finland) could also be expected given proximity and historical ties. France and Germany being in the same cluster is also consistent with this hypothesis. That the UK is an outlier is perhaps not surprising (e.g. Brexit, etc.). The USA has always followed its own path and therefore is also a high inequality / low redistribution outlier.
Which brings us to Canada, another outlier, the only low inequality/low redistribution country. It has maintained Nordic-type levels of low market inequality via the public provision of universal human-capital-enhancing programs (e.g high quality health care, education, etc.), while implementing only USA-type levels of redistribution. Current political battles and outcomes related to the minimum wage, taxes and social assistance indicate that market inequality-reducing measures (e.g. minimum wage, etc.) continue to be more politically-feasible than those that increase redistribution and reduce poverty outcomes (e.g. more progressive taxation, increased social assistance, etc.). While fighting to maintain and expand universal social programs, progressives should work harder to prepare the political ground for Canada to increase redistribution, especially for when market inequality increases.
Very interesting!
Figure 3 is particularly interesting. Overall, I like the comparison between market versus after-tax income in the analysis. I think it highlights the fact that solutions to rising inequality can be driven by policies other than taxation and redistribution via the tax system.
Beyond the policies you mention (minimum wage, universal healthcare, and affordable education in the case of Canada) what other policies or mechanisms could reduce inequality in market income?
In competition policy circles, some scholars (I’m thinking Ralph Winter in particular in an address to the CEA several years ago) posit that Canadians, in general, are not enthusiastic about redistribution. This is a reason why equality considerations are not central in Canadian competition policy (which I would categorize as a market-income solution). The attitude is that income inequality concerns are best addressed through taxation policy. I find it interesting that you seem to argue the opposite — policies targeting market income, like minimum wage, may be easier to implement politically than taxation-driven solutions. Could ease of implementation have more to do with our views of low-income Canadians rather than market vs after-tax income divide?
Thanks Robin, including your insight that equity is not one of the main considerations in Canadian competition policy, which I guess I am not surprised to hear.
Because, as you say, there is little enthusiasm in Canada for redistribution, my concern is that if we do not try to influence that mind-set we are at risk down the road of not being able to increase redistribution in response to an increase in market inequality.
My interest in Figure 3 was to highlight that there are many medium and high-redistribution countries out there, not just the Nordic “usual suspects” (e.g. Germany, France, UK, Italy, etc.). Each has achieved its own particular sustainable political equilibrium to be able to implement the corresponding taxation and transfer policies.
We have not been able to achieve that equilibrium in Canada.
We can count on non-progressive economists to oppose increased redistribution (and advocate reducing it). Among progressive economists I sense there is general agreement for more and more progressive taxation. But as the empirical evidence shows, that will only get us so far from a redistribution perspective – tax policy accounts for only about one-third of any redistributive impact.
The big (two-thirds) impact comes from cash transfers. In practice, an increase in the money amount and number of progressive cash transfers, such as social assistance and other cash-supplements. I sense that this is not a priority or consensus issue among progressive economists (for universality vs. targeting and other sticking points that have been discussed at the PEF and other fora).
In this context I would be interested in hearing from others with knowledge of how progressive economists in medium and high-redistribution countries (Finland, Sweden, Norway, France, Denmark, Germany Italy, UK) were able to reconcile these “sticking points” and be able to support and advocate for a high level of transfers in the mix of redistribution policy.