
Problematic sources of recent real wage growth
The past 18 months have seen real wages increase in Canada. (Yes, I double-checked.) Indeed, real wages have gone through two distinct phases of growth since the financial crisis hit the global economy in 2007. This may be surprising as we have been accustomed to hearing about the stagnation of real wages and the “decoupling†of wages from productivity gains over the decades preceding the crisis.
These real wage gains, however, are not that surprising once we take a look at the behaviour of inflation since the crisis. Stephen Gordon has taken a look at this over at Maclean’s; below, I offer another, somewhat different, perspective.
For much of the five-year period, inflation has been below the Bank of Canada’s two percent per year target. This despite record low interest rates. Normally, the story goes, lower interest rates are a spur to economic activity, driving businesses to invest and expand and households to increase spending. The increased activity then generates rising prices. This story has not panned out in recent Canadian experience.
While low interest rates have led consumers to take on record levels of debt, the rebound in business investment has been somewhat tepid. For now, the corporate sector has largely taken advantage of easy money at low interest rates to issue corporate bonds and refinance loans, pay out dividends to shareholders and expand an ever-growing stockpile of cash (now totalling over $600 billion). With high profits largely unaffected by the crisis, corporations are happy to watch asset prices rise and play the waiting game to see how the “recovery†of the economy looks in the longer-term. Monetary policy and fiscal austerity measures have combined to enable this scenario.
Consumers, on the other hand, have not had the luxury of being so patient. Rising housing prices stemming from overall asset inflation and the continuing deterioration of public services are only some of the factors driving households to take on credit and spend. The current easy credit bonanza has contributed to the continuing rise in Canadian household debt, unabated since the crisis and now at over 160% of income.
In a small, open economy like Canada’s, many other factors are also at play in setting macroeconomic conditions, stemming from our relationship to the rest of the global economy. For example, a slower but continuing commodity boom since the crisis that has, until very recently, maintained an elevated Canadian dollar has also contributed to keeping imports cheap and inflation down. Taken altogether, these trends have resulted in often below-target inflation and the post-crisis periods of low inflation has, as a result, coincided with periods of real wage growth.
The picture of average hourly real wages and inflation since 2010 can be neatly divided in two: one phase of higher, near 3%, inflation that saw falling average real wages and a second phase of lower, around 1%, inflation during which average real wages rose.
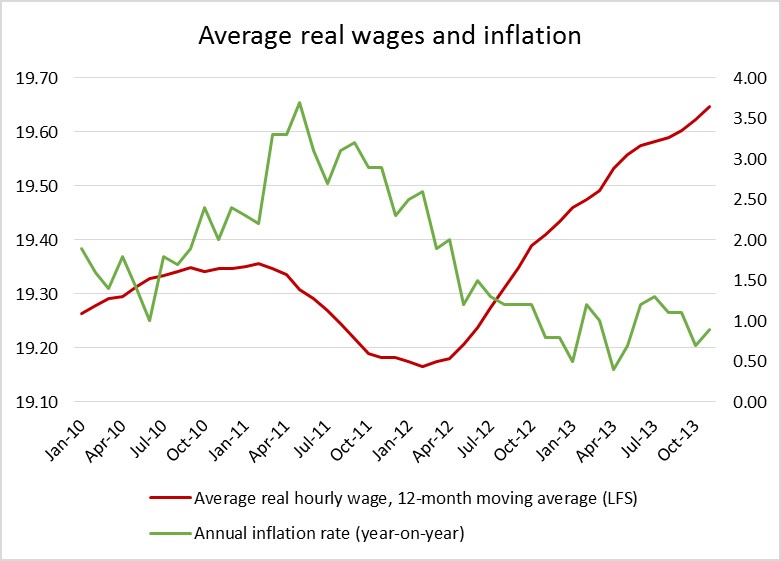
Figure 1. Inflation and average real wages, 2010-2013. Source: Statistics Canada, LFS and CPI data.
For workers it seems, the crisis has had a silver lining. As usual, however, there are several complicating factors behind this simple graph. First of all, while the unemployment rate has been slowly falling since the crisis, the last three years have also seen the employment rate drop to an even greater degree and stagnate. So even as our unemployment rate falls, our growing population and stagnant employment mean that Canadians are increasingly dropping out of the labour market completely. A not insignificant group of demoralized workers has left the labour force rather than even try to participate in the wage boom.
Second, while average real wages have risen, median real wages are actually lower than they were three years ago. In general, the median is better than the average at gauging what is happening to wages, as wage rates are unequally distributed. A wage floor compresses one tail of the wage distribution and a significant number of high-wage outliers draws out the other tail. This generally inflates the average wage. While Figure 2 shows that average and median wages surprisingly tracked each other relatively well for a while, they have now diverged again. The median worker has not seen real wages rise over the past 18 months.

Figure 2. Comparing average and median real wage growth since the crisis. Source: Statistics Canada, LFS.
This points to an greater bifurcation of the labour market with real wages growing for a smaller percentage of high-earners and stagnating or falling for a larger portion of low-earners. A recent report about Alberta`s job market describes exactly this phenomenon. The two-tier labour market in that province, where a large portion of jobs are in low-paying, low-quality service work, could rapidly become a model for the rest of the country.
Alberta also points to another factor behind the no-longer quite as rosy recent wage picture: Canada’s reliance on resource exports. R&D spending by Canada’s corporate sector has dropped even further below its already low levels. R&D now amounts to just 1.7% of GDP, down by almost 20% from just a decade ago. Sam Gindin has pointed out that total R&D spending by Canadian manufacturers in 2012 was lower than that of General Motors on its own, which has only the 5th highest R&D budget among US firms. Gindin states that the lack of R&D and a reliance on resources make Canada a “mid-tech†producer less able to quickly restructure its economy, even at the behest of significant government intervention and stimulus. Resource exports have been among the factors keeping the dollar high since the crisis, not only contributing to the loss of manufacturing capacity, but accounting for some of the real wage growth.
Yet relying on exchange rates to help boost wages is not a long-term solution; indeed, a number of factors have recently caused the dollar to change course and begin to depreciate in value. A significant fall in commodity prices over the past year – the Dow Jones-UBS Commodity Index fell 12% between mid-January 2013 and 2014 – has depressed the value of the currencies of many resource exporters and surely had an effect on the Canadian dollar as well. Weak job figures and worries about continued loosening of monetary policy have also contributed to the loonie’s dive.
This, finally, brings us to the crux of the matter. Low inflation is, at best, a temporary means to raise real wages. Even when lower inflation contributes to raising real wages, as in the direct aftermath of the last financial crisis, it can be, and often is, associated with concomitant negative effects. In Canada, these have included a commodity boom that has reduced innovation and productivity growth, greater bifurcation in labour markets and monetary policy that has largely served to increase asset prices, swell corporate cash stocks and drive ever-higher consumer debt loads. As I have argued elsewhere, low inflation is one of the myths of central banking, and focusing on it to the detriment of other macroeconomic goals often means placing the interests of asset owners over workers.
Workers have simply been lucky. Higher real wages have not been the intended target of current monetary and fiscal policies that have focused on raising asset prices and maintaining profits; they have been its unintended side effect and one that the policy of monetary loosening is partly intended to reverse. Here, I agree with Stephen Gordon: our governing classes will look for any means to reduce real wages in order to ensure that any further “recovery†will help their friends in boardrooms and with stock holdings. Recovery is not their preferred term for the improved working and living conditions for the majority of working Canadians.
So, in the face of theories and practices that see rising real wages as a problem, the main driver of real wage growth can be little else than increased worker bargaining power – and this, sadly, remains as depressed as ever. Union density continues to fall in Canada and the aftermath of the crisis has not changed this. At the same time, austerity policies from federal and provincial governments have inflicted disproportionate levels of harm on working people.
The path to genuinely increasing wages runs through political renewal and solidarity. We have the tools. Standing up to austerity measures, reigniting union organizing, and imagining alternatives should be high on the list. Only when we begin to use these tools can be being to counter absurdities such as unintentional rises in real wages. Imagine a monetary policy that rather than working to raise asset prices and grow corporate cash piles while accidentally raising real wages in the process is instead geared towards public investment in high-value-added social production that puts improving real wages and working conditions at the centre of its agenda. Now there’s an “absurdity†worth fighting for.
During the Great Depression real wages didn’t decrease despite mass unemployment and cuts to nominal wages – because prices were falling even faster. The IMF just warned that today’s low inflation is just one step away from deflation. Did anyone say recovery? It’s stagnation time again.
There are quite a few sources for income measurement and wage rates. Unfortunately I would conclude that the LFS is my least favourite in terms of reliability and also in terms of validity- especially given the census debacle which is used to benchmark and many estimation parameters for the LFS.
There are many reasons I could give but it is a difficult space to explain.
1) There has been a measured impact on the frame and benchmarking of Census and hence the sampling strategy of the LFS has been impacted- I am unsure of the timing of the census implementation for benchmarking so not sure how much has been impacted- potentially there were other methods used given the facts that are being published on income bias that has occurred.
2) there has always been a problem with response rates for this field, in fact at one point the LFS stated outrightly to use caution when using this data. I do know it is a problematic field and non-response is a real issue as people tend not to like to disclose this information.
3) there is always the issue of what exactly is being reported in terms of reporting periods.
However that said, I am sure it does indicate some proximity measure related to wage levels. Also as it does not reflect families- and only reports individuals- which as you know are two different social measures. However if one is asking about wage levels then of course individuals are the more likely unit. And finally I would say that given the polarization in income being reported, assuming we can measure it properly given the census debacle, I do wonder about what if anything the average salary has to say about anything anymore.
Adding onto this I am not sure how well the median performs in this sample given the non-response and sampling issues mentioned. If you give me a frame with a cross section based on income dynamics, then I might be more inclined to go with the median- however this survey was designed to measure unemployment and to get a good estimate of income centering one needs a good cross section of the income distribution, that I am not sure is being achieved with the LFS. Employment and unemployment- yes- but income- would need another route. One can use the estimate, but I have problems in the way it is collected- so I would basically be trying to verify these outcomes with other sources.
I mean to add that potentially using the SEPH data might be a helpful addition to your post. It is a bit more robust for wage estimates, however it has little in terms of demographics. But alas it is payroll data and has a lot more to draw on in terms of wages.
Paul, you beat me to it! I was just going to respond and thank you for the previous comment as well as mention the SEPH data.
I’ve known that the LFS data is not the best but your comment makes a good case about the true extent to which this is the case. I think you may be right that the LFS should only be used for employment and related measures. From what I gather, SEPH, while it has some of its own issues, is better — precisely, as you point out, because it is based on payroll data and not subject to all the potential biases that come into play when someone is asked about their earnings (framing, response rates, etc.). I think especially the framing piece is important here, earnings are a touchy subject and a measure of social success. We may even unconsciously be adding biases to our own estimates of our earnings, nevermind trying to appear one way or another.
I’ve done a comparison of LFS and SEPH data for this last period in terms of average wages and, importantly, the growth trend they show is pretty much exactly the same. For the purposes of this article, that was the most important aspect of the data. As I happened to have median data for the LFS, I chose to use this. Given some of the recent trends in the economy around falling participation, greater precarity, more part-time work and a “hollowed out” middle not just in terms of income but in terms of jobs (as in the Alberta example), I think there is something behind the difference that’s showing up between the average and the median, but I agree that because of the surveying issues, there may a significant portion attributable to statistical inaccuracy and artefact.
Anyhow, good to have someone with your statistical expertise and experience at StatsCan commenting on these issues and keeping everyone cognizant of the workings of the dark data machine that is StatsCan — one increasingly underfunded, which comes out in not only the increasing lack of data, but also problems with data quality. The takeaway lesson is that I’ll try to stick with SEPH from now on for earnings data.
Good post. Re the data issue, last I looked the median hourly wage tended to change rather abruptly. You might look at changes in average hourly wage by high and low wage occupational groups. I prefer to look at LFS because occupational data is much more relevant than data by industry if one wants to get at wage inequality issues.
Yes, certainly a number of measures do show real wage increases in recent years, but this is largely because of lower CPI inflation. Those with negotiated agreements have their wages increases determined for a number of years: what provides a real wage increase in one year with low inflation might not in another year with higher inflation.
We also need to be skeptical of the use of CPI inflation as a measure of the cost of living. There are many different measures of inflation and different people and demographics, as well as different regions, experience changes in the cost of living quite differently.
Other problems with the CPI are that it has inadequately accounted for changes in the cost of housing and also does little to account for faster effective depreciation of consumer goods, through increasing technological obsolescence or simply cheaper quality.
What Toby said regarding CPI, as recently posted here.
Also, be careful with SEPH data, as just posted here. The following day, StatsCan’s November 2013 SEPH release for the first time acknowledged the surge in unclassified jobs:
With the March 31 release of January data, SEPH will be incorporating an additional method in assigning 2012 NAICS codes to businesses. The impact of this change will be seen in a reduction of the current payroll employment level in the unclassified businesses category, while corresponding increases will be seen within various classified industries. This method will be applied back to 2008.
If you’re educated (or seeking an education) you will probably find a ton of opportunity in
a small town. When job offers do come and I’ll admit, some companies
may fear hiring you because they fear a former owner being an employee, negotiate the best salary you can
along with the best benefits you can for you and your family.
Clients do not look no matter whether you’ve a small or big budgeted communication service.